The growing extent to which the electricity from decentralised photovoltaic systems is fed into the low-voltage power grid requires that new measures be taken to stabilise the power grids. There are also new loads due to electromobility and the increasing use of heat pumps. The previously presented concept of the grid traffic light can be a key tool for efficiently operating the power grid. It prevents an expensive grid expansion or helps to determine exactly where such an expansion would make sense. The grid-control research project involves implementing the grid traffic light concept and a trial run under real-life circumstances in a field test. Seven2one is one of the nine project partners. Our task is to establish load management in the distribution grid and flexibility management for the market participants.
How the software solution was created
Both the Flexibility Management System (FMS) and the Grid Load Management System (GLMS) are stand-alone databases based on our Seven2one platform. The FMS takes over a wide array of data from various upstream systems (BEMS, GIS, ENTSOE). The required data, such as the metering point topology (description of the metering point topology in the following order: metering point >> virtual metering point >> node >> cluster), the installed capacity of the flexibilities aggregated at cluster level, the inflexible schedules (consumption and generation per virtual metering point), the flexibility corridors within which optimisation is to take place, the non-discriminatory quotas (description of how much flexibility can be used) and, last but not least, the day-ahead electricity prices, is automatically transmitted to the optimiser (DataLink, Time Series Exporter, Analyst Exporter). For all existing flexibilities, the optimisation provides schedules that are transmitted to the GLMS (DataLink) after being aggregated together with the inflexible schedules on the node level.
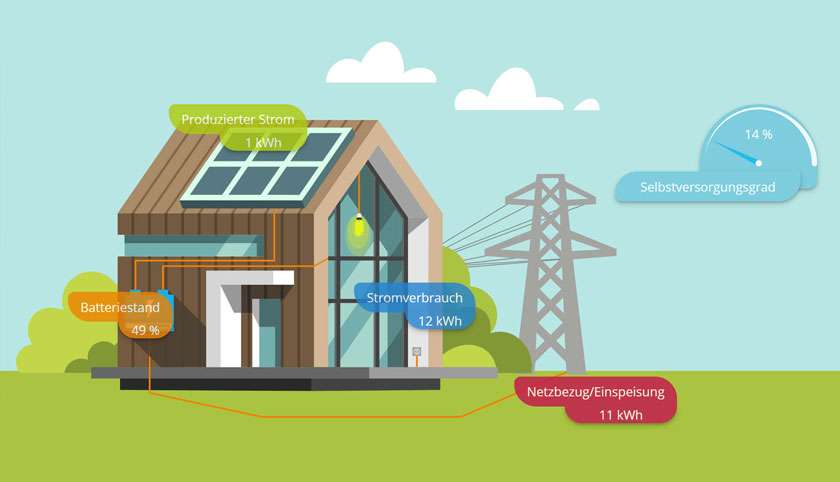
A web-based interface, also provided by Seven2one, is used for visualisation and monitoring of generation and consumption. The web-based interface has several layers and shows different content depending on which user is logged in. Prosumers who are participating in the field test have their own view that shows them information about their own consumption, generation, flexibility and degree of self-sufficiency. The web-based interface can be accessed not only by participating prosumers but also by citizens interested in the project. However, for reasons of data privacy, the general public is “only” provided with aggregated values from the overall area of Allmend.
Marketplace for flexibilities emerges
The more renewable power generation installations there are on the grid, the greater the need for flexible generators and loads. These can be stationary batteries or electric vehicles that can be used in a manner conducive to efficient grid operations as well as combined heat and power units (CHPs), heat storage units and power-to-X plants. Due to the growing demand for flexibilities, there is room for new business models that offer market participants flexible loads and demand-driven generators. This means that an additional market for flexibilities can emerge alongside the existing energy balancing market and the spot market.

What happens next in the grid-control project
With nine project partners, it was particularly challenging to finally assemble the individual pieces of the puzzle so that everything worked. This required a great deal of coordination and communication. It worked out well in the end, and the project is now operating successfully.
We have been collecting data from the field test area since the start of the field test in October 2017. The sunny periods have only recently begun to be recorded, showing how the system responds to yellow traffic light phases. In this case, optimisation is based not on the electricity price but on efficient grid operations. This will be another important milestone in the project.
The little grid-control glossary
GIS data
Information about the cable cross-sections, the cable lengths and the geographical positions of the cable sections.
Activation quota
Indicates the “margin” for flexibility usage
Capacity limits
The cable cross-section provides information about how much electrical power can flow through the respective cable.
Quotas
There are two types of quotas: the deviation quota (for green traffic lights) and the activation quota (for yellow traffic lights). The deviation quota indicates how much one may deviate from one’s own schedule. The activation quota specifies how much of the installed power may be activated.
Node
Several prosumers and consumers are consolidated in one node.
Cluster
The individual nodes are consolidated in a cluster on the basis of GIS information.
Load forecasts
Consumption forecast for the following day.
Electricity prices
Input data for flexibility marketing.
Green traffic light phase
No power shortage has been forecasted.
Yellow traffic light phase
A power shortage has been forecasted.
Optimisation
In the green traffic light phase, optimisation is based on the electricity price. When a yellow traffic light phase is predicted, optimisations that are conducive to efficient grid operations are carried out.
BEMS
The building energy management system administers the energy flows of a household.
GLMS
Grid load management system.
FMS
Flexibility management system.
Blogroll of grid-control project
Guest article in the “Dialog.Energie.Zukunft” blog by grid-control project manager Katharina Volk, Netze BW GmbH


0 Comments